Wednesday, March 30, 2011

Apparently, size does matter….the hippocampus size, that is, in people with current vs lifetime PTSD


Or at least that’s the conclusion drawn by authors of a recent study that was published in Biological Psychiatry. Apfel et al. did a structural MRI study of 244 Gulf War vets and controls and compared the size of the hippocampus across subjects, and concluded that only current symptoms of PTSD appeared to be associated with it. Since the journal put out a press release about it, I figured there was something unique or novel about the study and decided to look into it.

The authors assessed lifetime and current symptoms of PTSD, in addition to a whole bunch of other variables such as such as alcohol use, depression, etc in a large sample of Gulf War vets. They then talk about the MRI part of the study, measuring pixels, and so on, and then provide the following figure (see below) – I am not sure why since all it really does is show where the hippocampus is. And if you are interested in this line of work, you probably already know that. It reminded me of stars making cameos in movies – interesting and attention-grabbing, but generally somewhat purposeless.


Anyway, onto the results, where the authors throw in all these variables in a massive regression to predict hippocampus volume (corrected for intracranial volume), and then show that only current PTSD symptom scores were a significant predictor. However, the amount of variance accounted for in hippocampal volume was not exactly stunning – an adjusted R2 of 2.6%.

This next part is what had me scratching my head. So far the authors worked with just symptom scores. But, at this point, they split up their sample into groups based on trauma and PTSD diagnoses – so you get:

1.)    a group with no trauma (and by definition, no PTSD),
2.)    a group exposed to trauma, but no PTSD,
3.)    a group with lifetime, but no current PTSD (what they call remitted), and
4.)    a group with both lifetime and current PTSD (called chronic).

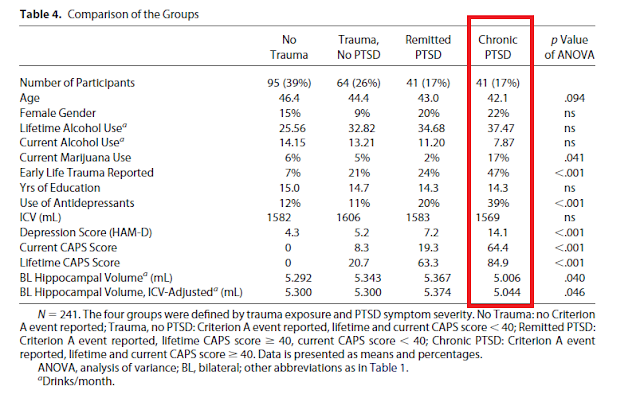
Notice what’s missing here – a group with current PTSD alone (in fact, only 3 people in the sample had current PTSD alone but they dropped them from the analyses!). And as you would expect, the chronic group had the highest rates of almost everything – the highest levels of trauma, highest lifetime AND current PTSD symptoms, highest rates of antidepressant use, etc. I have highlighted this column in red in the table from their paper below.


Next, they compare hippocampal sizes among groups using an ANOVA (as far as I can tell, without controlling for anything else) and show that the mean hippocampus volume of the chronic group is significantly smaller than that of the remitted group by 6.5% and that of the subjects with no PTSD by 5.1%. Still with me so far?

They then conclude that the size of the hippocampus is only affected by current PTSD symptoms and not by lifetime symptoms…..Here’s where they lost me. I am not sure I see the rationale for this conclusion. If they had done a regression with the lifetime and current symptoms of PTSD predicting hippocampal volume only in the chronic group, or had they even had a current PTSD only group with smaller hippocampal volumes, their conclusion would seem supported. However, since their analyses using current PTSD symptoms and their analyses using chronicity were done separately, their conclusion seems somewhat premature.

In other words, their measure of chronic PTSD is confounded with current and lifetime symptoms of PTSD, and doesn't really support what they are saying. Further, a basic pubmed search revealed several prior studies on hippocampal size in disorders such as PTSD and depression (with quite a few conflicting results). So they are not exactly breaking new ground here either. And reductions in size of 6.5% and 5.1% are not exactly earth-shattering. Which leaves me pretty puzzled as to why a press release was attached to this article....


Apfel BA, Ross J, Hlavin J, Meyerhoff DJ, Metzler TJ, Marmar CR, Weiner MW, Schuff N, & Neylan TC (2011). Hippocampal volume differences in gulf war veterans with current versus lifetime posttraumatic stress disorder symptoms. Biological psychiatry, 69 (6), 541-8 PMID: 21094937

Sunday, March 27, 2011

So...how many of us do really have personality disorders?


Inspired by this post on Neuroskeptic’s blog on the rates of personality disorders (PDs) in the UK, I decided to look up some stats on PDs in the US. The most comprehensive survey of the prevalence of PDs in this country to date is the National Epidemiologic Survey on Alcohol and Related Conditions (NESARC) undertaken by Grant and colleagues. This was a pretty impressive survey of mental health problems in the general population consisting of approx. 40,000 respondents carried out not once, but twice – of the same subjects, with a 2 – 3 year interval!

When results of the first part of the survey or Wave 1 initially came out, the sheer prevalence of PDs appeared somewhat surprising (link here with a nice bar graph of all the PDs they assessed) as apparently 30.8 million (or 14.8%) in the US population had at least one personality disorder. Additionally, the authors had left out three PDs out of Wave 1 (borderline, schizotypal, and narcissistic) due to difficulties in assessment. However, they did manage to assess these in the second wave conducted about 2 – 3 years later, and when these were added to the estimates, a more recent study by Trull et al. (2010) found that the overall prevalence of PDs shot up even more to 21.5%.

This latter study also tried to clear up the mystery of high PD rates by tightening up the criteria for distress/impairment used in the NESARC survey. The original authors (Grant et al) required that distress/impairment be associated with only one criterion for each PD for a diagnosis. The revised estimates by Trull et al (2010) required every criterion for every PD to be associated with impairment. Naturally, this made it harder to be diagnosed with any PD, and the prevalence of PDs dropped quite drastically from 21.5% to 9.1%. However, according to Trull et al, it also brought it more in line with other previous surveys of PDs to date. So, we can already see glimmers of some problems with PD rates calculated by NESARC so far.

Additionally, when wading through these articles what caught my eye was this paper from the NESARC group. Keep in mind that some PDs were assessed only in Wave 1, while others were assessed only in Wave 2.

So:

Wave 1: Paranoid, Schizoid, Antisocial, Histrionic, Narcissistic, Avoidant, Dependent, Obsessive-Compulsive

Wave 2: Schizotypal, Borderline, Narcissistic

This paper on correlates of borderline PD states in its abstract that, “With additional comorbidity controlled, associations with bipolar disorder and schizotypal and narcissistic PDs remained strong and significant”. That made me pause a few seconds.
So, in other words, even after taking out the effects of all other co-occurring Axis I and II disorders, the three PDs that were specifically assessed only in Wave 2 had some sort of special relationship….? That seems like quite a coincidence to me.
The authors don’t discuss the possibility that this might actually be an artifact of assessment at all and seem to consider this a “true” finding. In fact, if their tables are anything to go by, their results indicate that a whole bunch of people developed these three specific PDs between Wave 1 and Wave 2, or alternatively, that their survey is not working quite as well as they think.
Here’s a condensed version of these findings from the paper (Table 4 from their paper – I’ve cut down quite a few columns and rows to make it easier to read) that details the odds ratios of associations between borderline PD and any other disorder after controlling for associations with all other remaining disorders (both Axis I and II) and sociodemographic characteristics.

And you can immediately see that the odds ratios between borderline PD, and schizotypal and narcissistic PDs (those assessed only in Wave 2) far exceed those of all the other PDs (these were assessed only in Wave 1). The only other disorders that come close are bipolar I and II. I’ll leave you to draw your own conclusions.
This paper has been cited quite a few times (89 according to Google) since it was published, and a quick skim of the citing articles suggested that no one had really questioned the validity of these estimates (though it is very possible that I could have missed something).
Clearly, a survey like NESARC is an impressive undertaking – face to face standardized interviews of 40,000 people carefully selected to be representative of the population, and re-interviewed in 3 years is no small achievement. However, data for the sake of data, without a deeper investigation of what the numbers mean is not really useful, and worse, can be potentially misleading.


Grant BF, Stinson FS, Dawson DA, Chou SP, Ruan WJ, & Pickering RP (2004). Co-occurrence of 12-month alcohol and drug use disorders and personality disorders in the United States: results from the National Epidemiologic Survey on Alcohol and Related Conditions. Archives of general psychiatry, 61 (4), 361-8 PMID: 15066894

Grant BF, Chou SP, Goldstein RB, Huang B, Stinson FS, Saha TD, Smith SM, Dawson DA, Pulay AJ, Pickering RP, & Ruan WJ (2008). Prevalence, correlates, disability, and comorbidity of DSM-IV borderline personality disorder: results from the Wave 2 National Epidemiologic Survey on Alcohol and Related Conditions. The Journal of clinical psychiatry, 69 (4), 533-45 PMID: 18426259

Trull TJ, Jahng S, Tomko RL, Wood PK, & Sher KJ (2010). Revised NESARC personality disorder diagnoses: gender, prevalence, and comorbidity with substance dependence disorders. Journal of personality disorders, 24 (4), 412-26 PMID: 20695803

Saturday, March 26, 2011

Peer Review


The process of peer review has been critiqued on several grounds - it doesn't always prevent bad or flawed science from being published, doesn't always let good research in, and is riddled with problems like academic rivalries, and bias towards well-known scientists and institutions.

Now, a recent meta-analysis of previous studies on peer review says that inter-rater reliability (the degree to which two reviewers agree on a manuscript) is very low - .17 to be precise.

Which then leads to the question - what exactly is the point of peer review?


Bornmann L, & Daniel HD (2010). The usefulness of peer review for selecting manuscripts for publication: a utility analysis taking as an example a high-impact journal. PloS one, 5 (6) PMID: 20596540